How it Works
It's quick and easy to get started.

Add Swell to Slack or Teams
When you add Swell to your Slack or Microsoft Teams account, you will see the Swell Chatbot in your Apps. The Swell Chatbot will deliver your check-ins directly to your team, in Slack or Teams.
Use one of Swell's Recommended Surveys or Author Your Own
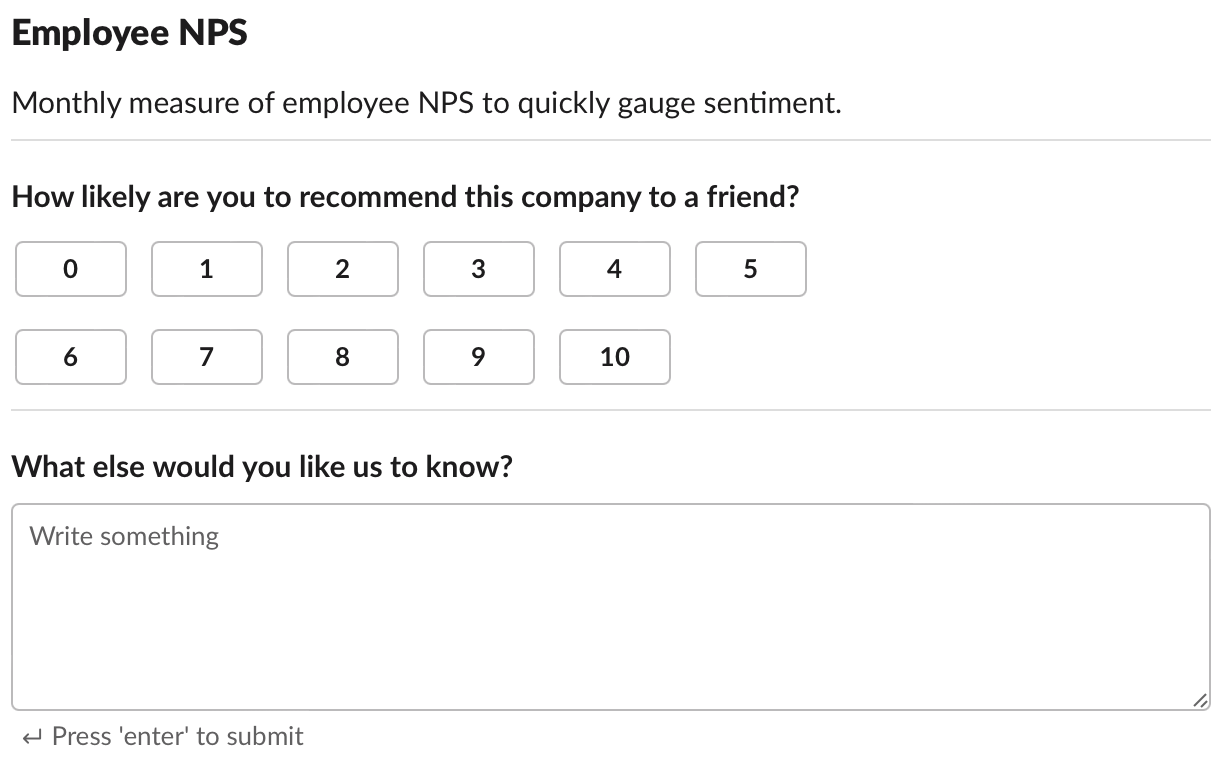
Swell includes psychologist-designed surveys that you can use right out of the box. These surveys are designed to take advantage of Slack or Teams by frequently delivering very short check-ins, allowing you to gather a wealth of data to discern trends. You can also choose to create your own surveys and ask the questions that are most important to you.

Check-Ins are Delivered to Whom and When you Choose
You can configure check-ins to deliver at a frequency of your choosing. You can also choose which Slack Channels or Teams will receive check-ins to ensure the correct audience. Once these options are configured, you can rely on Swell to deliver check-ins to your team.

Your Team Responds Directly in Slack or Teams
The Swell Chatbot will deliver your survey questions directly to your team in Slack or Teams. This means they no longer have to go searching through their email for their survey invitations, and get taken out of their flow to respond. This will help to ensure high response rates, and give you a much stronger handle on your team's engagement and sentiment.
Track Employee Sentiment Over Time
Once you start receiving responses, you can log into Swell to view the results. Crucially, you'll be able to see how these results trend over time, so you can understand how company initiatives or important events are impacting your team's engagement. With Swell, you can even add Milestones to keep track of these events, and see how they affect your data.
